
Does Polymarket Know Which Way BTC Will Move?
A look at BTC Up/Down predictions before the period open is known.

Polymarket links in this post are referral links
Polymarket’s Up or Down crypto markets ask one question: will the candle close be higher than its open? In theory, before the candle opens, the probability of it going up or down should be close to a 50/50 coin flip. In practice, it is quite common to see prices fluctuate, with one side at $0.48, $0.46, or even at $0.44, as if the crowd already knew the likely direction. Betting and trading start long before the open price is known.
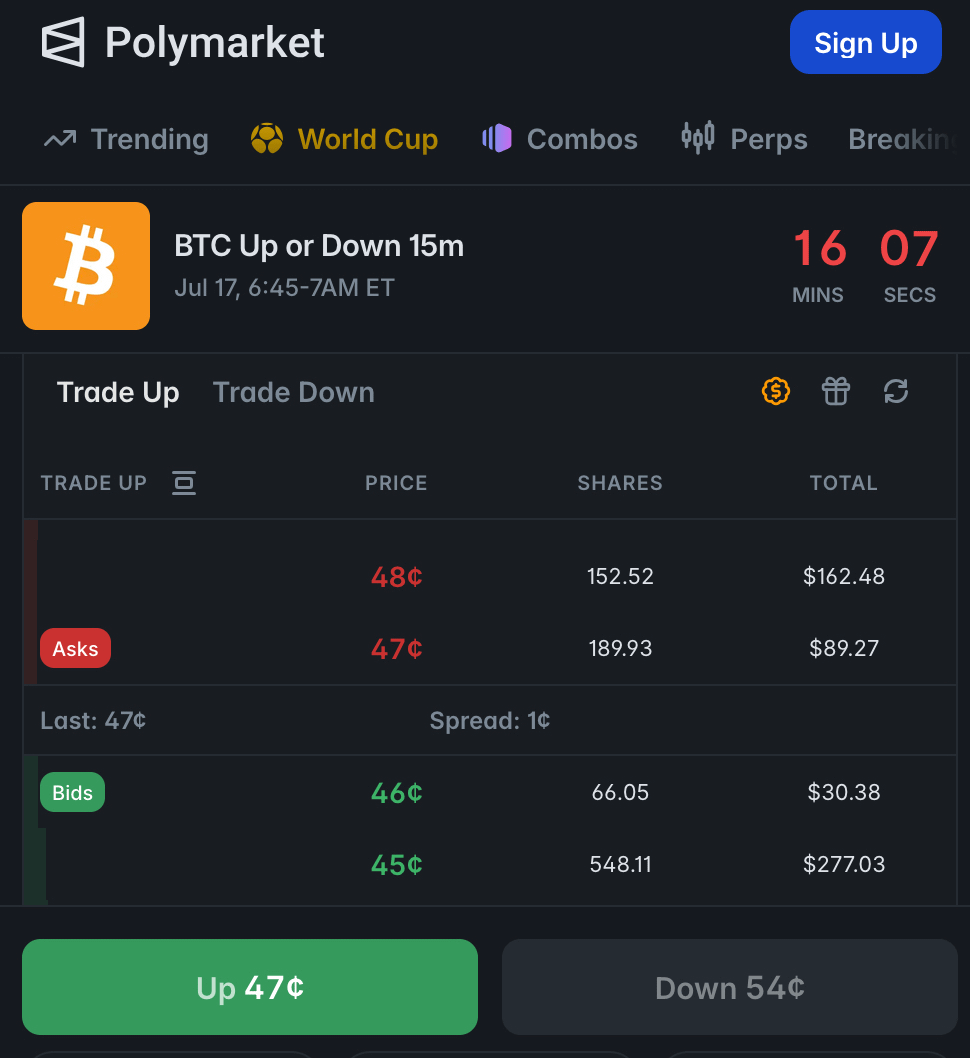
This skew made me curious to study three questions:
When does the skew appear? Early, or only just before the period opens?
What range is typical? Can it exceed 60/40?
Prediction vs Reality. If the market says 55% Up, does Up win 55% of the time?
Data
I was mostly interested in the 15-minute BTC market, with checks on other timeframes as well. From the Polymarket endpoint, I pulled order-book history from November 2025 through July 2026 — one-minute snapshots of mid prices (bid/ask average). I used only the Up mid prices, because the Down mid should always be 1 − Up.
After filtering out bad data (empty history, missing pre-open prices, price disagreements, stale snapshots, and so on), about 23,700 markets remained with a clean snapshot 1 minute before open. Of those 19,439 had clean snapshots at all seven offsets before open: 60, 30, 15, 10, 5, 2, and 1 minute. I used this balanced panel for the first question, so the market mix is identical across offsets, and the full 23,700 for the rest analysis.
When does the skew appear?
Here is the answer in one picture. Each vertical slice is the distribution of pre-open prices at that offset, with quantiles shown. An hour before open, the price reflects a coin flip, 90% of prices sit between 0.495 - 0.505. Skew only shows up closer to the period open, mainly in the last 5-10 minutes, and the range is widest at 1 minute out. This makes sense, whatever models traders use, the most relevant information arrives near open, not an hour before.
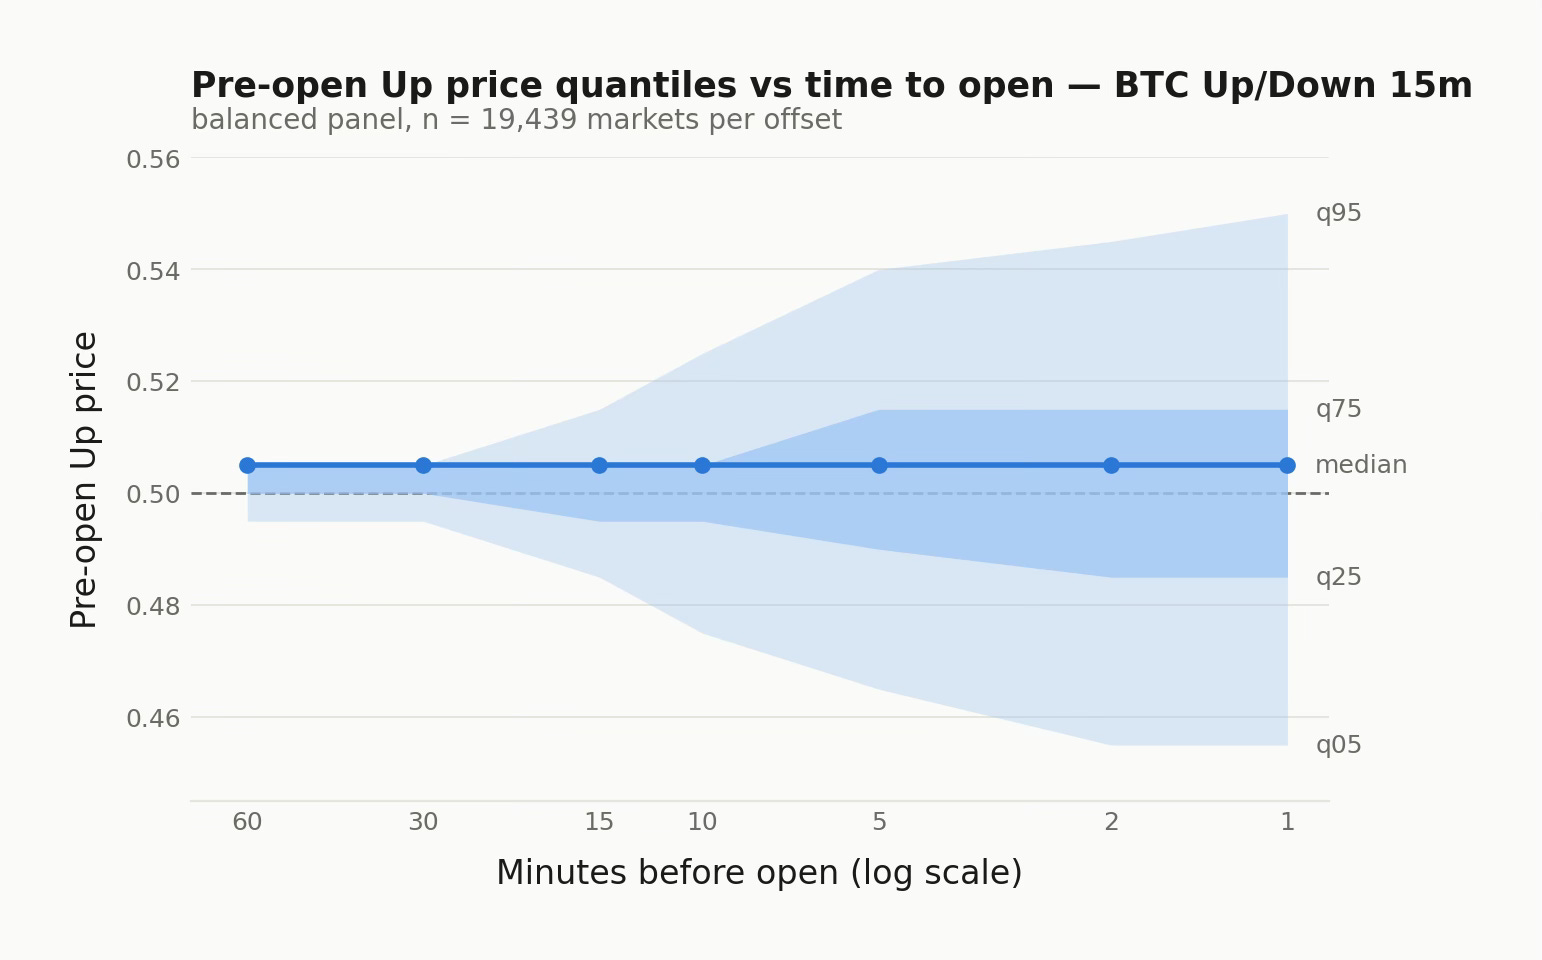
One small curiosity: the median mid sits at 0.505 rather than 0.5 at every offset. Part of this is mechanical: with 1¢ ticks and a 1¢ spread, the mid can only be 0.495 or 0.505 — but books lean toward the higher, Up-premium configuration more often. This plot also gives us a preview of the second question.
What range is typical?
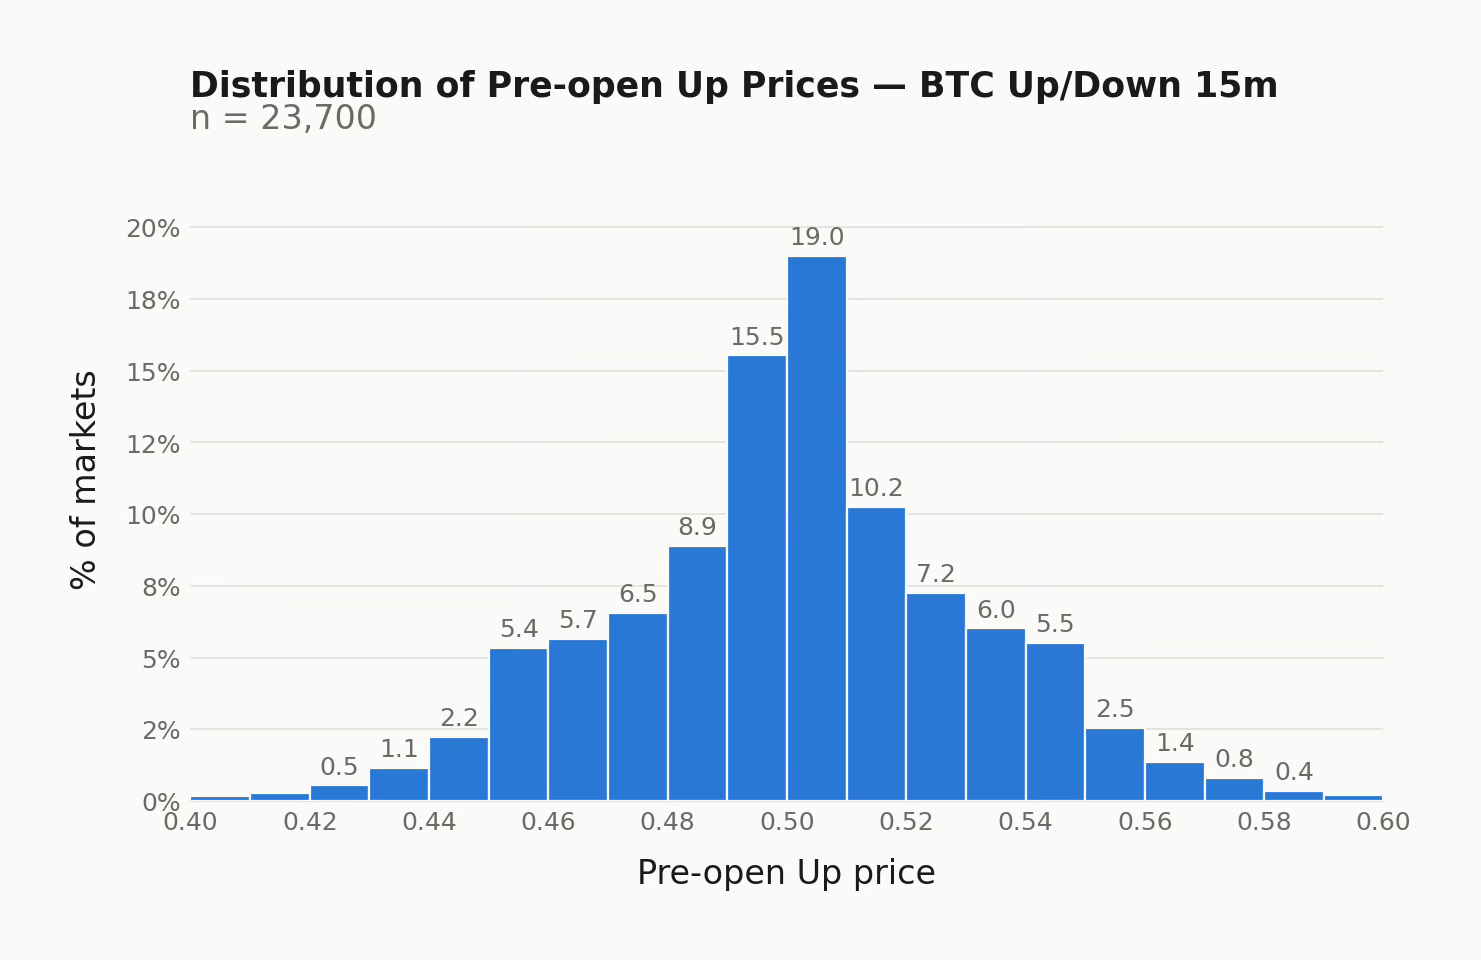
Here I looked at prices 1 minute before open. The short answer to "can it exceed 60/40?" is: almost never. Even at that point, 90% of markets stay within ±5 cents of a coin flip (0.45 - 0.55), and 99.9% of prices are between 0.4 and 0.6. The histogram below peaks at 0.49 - 0.51 as expected, but more than 65% of markets sit outside that peak — and those are the main interest of this study.
Prediction vs Reality
That brings us to the third question: should you trust the prices? I bin the implied probabilities (Up mid-prices from the snapshot 1 minute before open) into 1-cent bins, keeping at least 1,000 markets per bin and putting leftovers into the edge bins. The x-axis is each bin’s mean Up price, while the realized Up frequency is on the y-axis. Dot size scales with bin count, the 45° line is shown as the reference for ideal prediction, and the whiskers are 95% confidence intervals:
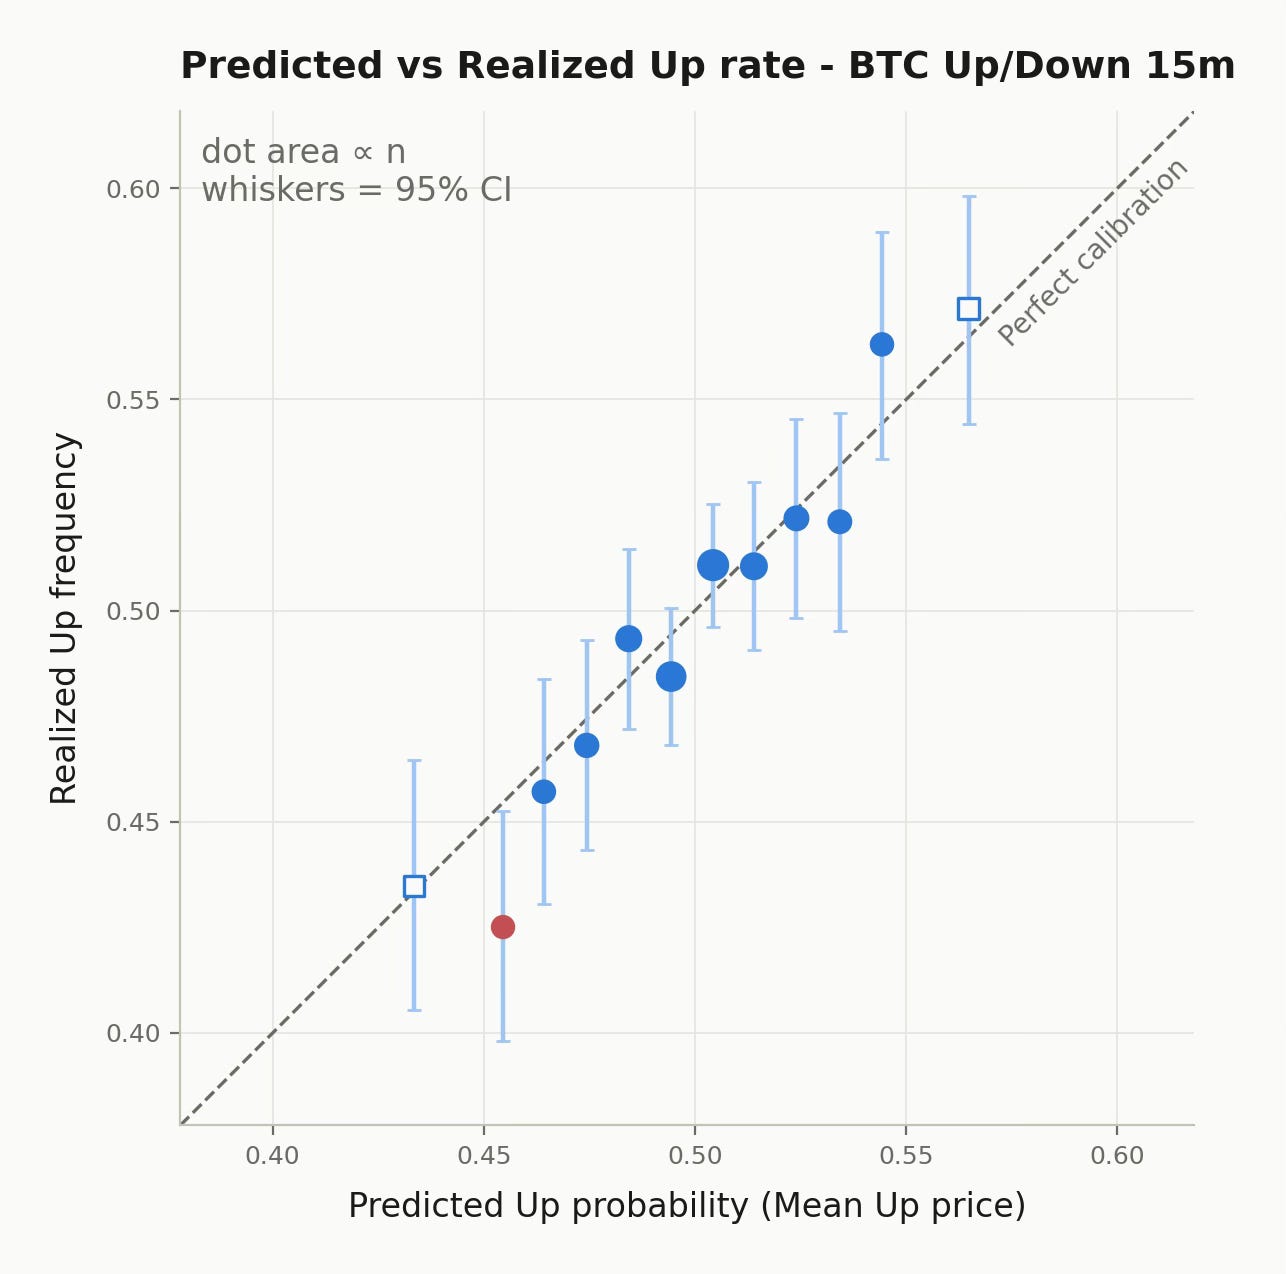
The realized outcomes follow the reference line closely. From bins below 0.45 to above 0.55, realized Up frequency matches the quoted price to within about a cent in nearly every bin. Markets priced near 56.5¢ resolved Up 57% of the time; markets priced near 47.4¢ resolved Up 46.8% of the time. Only one bin (0.45-0.46, shown as red dot) has a confidence interval that falls statistically off the diagonal, which is about what you’d expect by chance across twelve bins.
Here is the complete table of the bin values:
What does this mean?
So, does Polymarket know which way BTC will move? A little, and that little is already in the price. These pre-open prices aren’t random noise. On average, they are a good forecast of Up vs Down in a short range of ±5 cents. If you were hoping to trade against the pre-open skew, thinking that true odds are 50/50 and the skew is an a opportunity, the data shows there is no statistical edge in that. And keep in mind that everything above uses order book mids, not executable fills. A taker crossing the spread also pays a fee, so a mispricing this small can easily turn into an unprofitable trade. Whether passive maker orders, which earn rebates instead, can capture any edge is a different question.
Still, I hope this gave you some intuition and new ideas for research. It gave me some. I’ll unpack them in later posts.
Stay tuned!
Method notes: 23,909 raw BTC 15 min Up/Down markets, Nov 1 2025 – Jul 8 2026 (249 days). All prices here are order-book mids, not executable fills. Order books snapshotted at fixed offsets before each open; markets with empty histories, stale quotes (>60s), or Up/Down books disagreeing by more than a cent excluded (~0.9% of the sample). The skew-vs-time analysis uses a balanced panel of 19,439 markets clean at all seven offsets, so the market mix is identical across offsets; calibration uses all 23,700 markets with a clean 1-minute snapshot, binned in 1-cent buckets of ≥1,000 markets, with Wilson 95% intervals.
Other timeframes
Here’s a sneak peak of the same analysis for 5-minute and 1-hour markets. The 1-hour series uses 2 cents bins because there is less data. The plots show a similar picture: the outcomes follow the reference line quite closely. More data and detailed results on Github.


Resources
GitHub Repo — all datasets (full parquet + cleaned CSV), notebooks, and the scripts to re-download everything from Polymarket's public APIs.
Github Results for every timeframe — all plots and tables for 5m, 15m and 1h
Run the notebooks in Colab — one click, no setup
Polymarket — Prediction market platform discussed
Polymarket API docs — the free public APIs (Gamma metadata, CLOB price history) this data comes from