
Polymarket Predicts BTC Direction. Can You Trade It?
Using Up/Down markets as an entry signal on a crypto exchange

In the last article Does Polymarket Know Which Way BTC Will Move?, I found that Polymarket’s BTC Up/Down markets predict the next candle direction surprisingly well. The prices are very close to the realized frequencies.
This suggests an idea: can I use it as a signal? If, for example, I see the market at 0.55/0.45 a few seconds before the candle open (a 5-cent skew toward Up), I can enter a position in that direction on a crypto exchange, and hold it until the candle closes. I should win 55% of the time — and the previous article says I really would, but do I have an edge? Let’s find out.
These questions will help us understand if this idea is worth something. Try answering them yourself before you continue reading:
How much does an ordinary candle move (5m, 15m or 1h)?
Are wins and losses symmetrical?
Does it survive fees?
How much does an ordinary candle move?
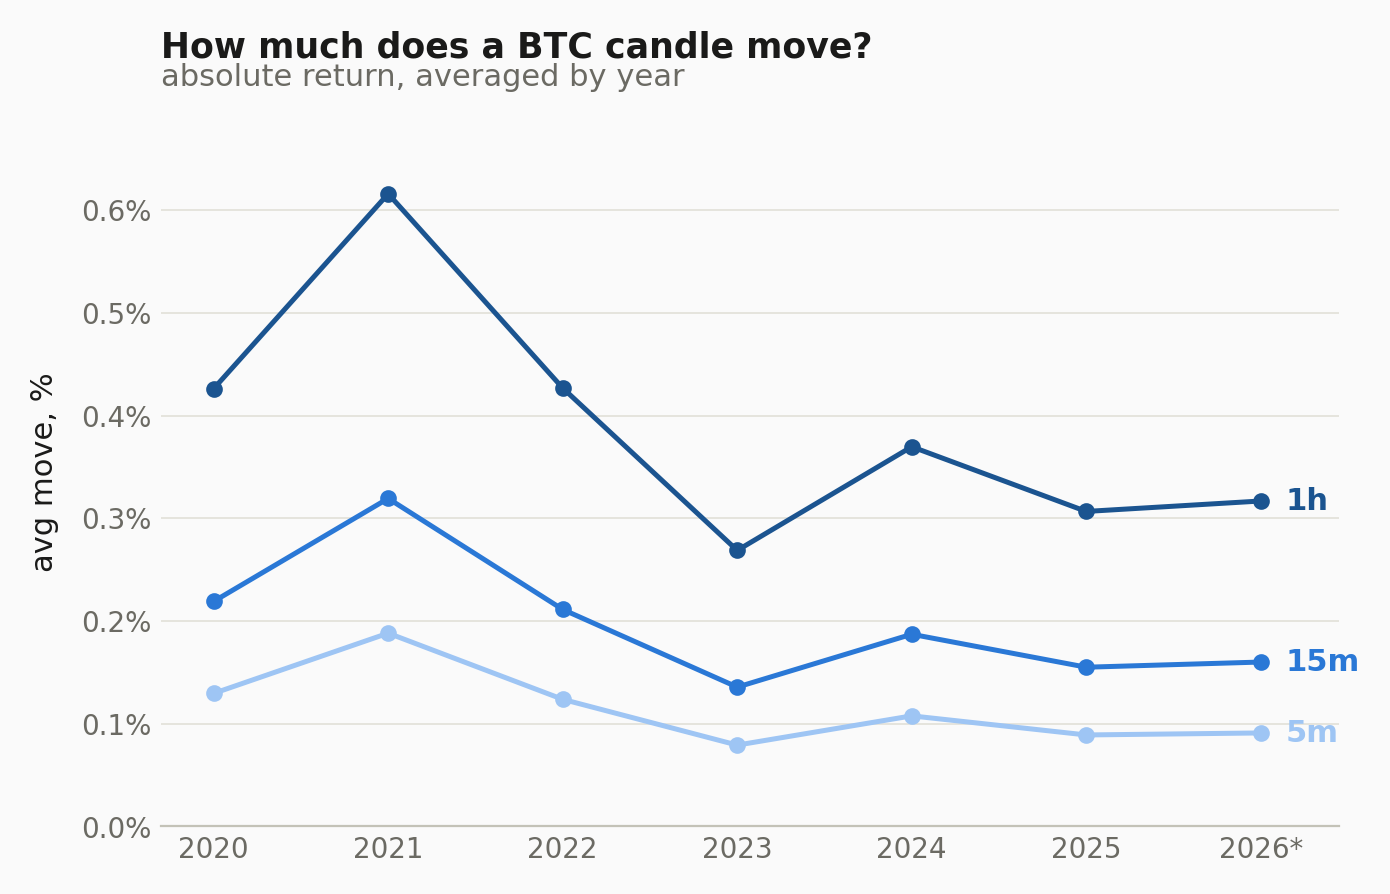
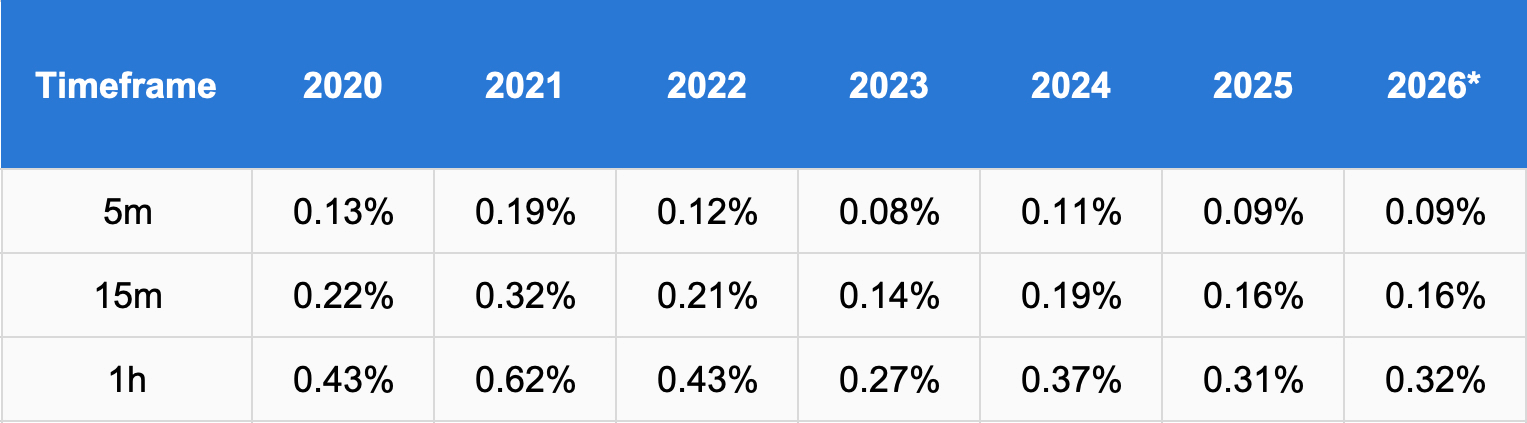
The timeframes that I’m interested in are 5m, 15m and 1h, since those have the largest Polymarket datasets. For average absolute candle returns, I used Binance BTC/USDT spot 1-minute data from 2020 to 2026, resampled to each timeframe. The results, grouped by year, are shown below in a plot and a table:
*2026 to 1 Aug
Look how well the square root of time rule holds for every year. A 1h candle is four times longer than a 15m one and moves about twice as far (in 2026, 0.32% vs 0.16%). Which gives us an intuition. If short candles are too small to pay fees, trade longer ones. We’ll see in the next section if this is true.
As you can see, 2021 was the most volatile year, and since then average candle size has fallen by half. It is important to use the latest data rather than the full dataset so you are not biased by earlier, more volatile periods. This data is already enough for a quick calculation of potential edge and breakeven fees using the simple formula:
Edge = (Win Rate × Average Win) - (Loss Rate × Average Loss)
Assuming symmetric wins and losses:
Edge = Average Move × (2 × Win Rate - 1)
With a 55% win rate (probability skew) and 2026 average move we get these potential edges:
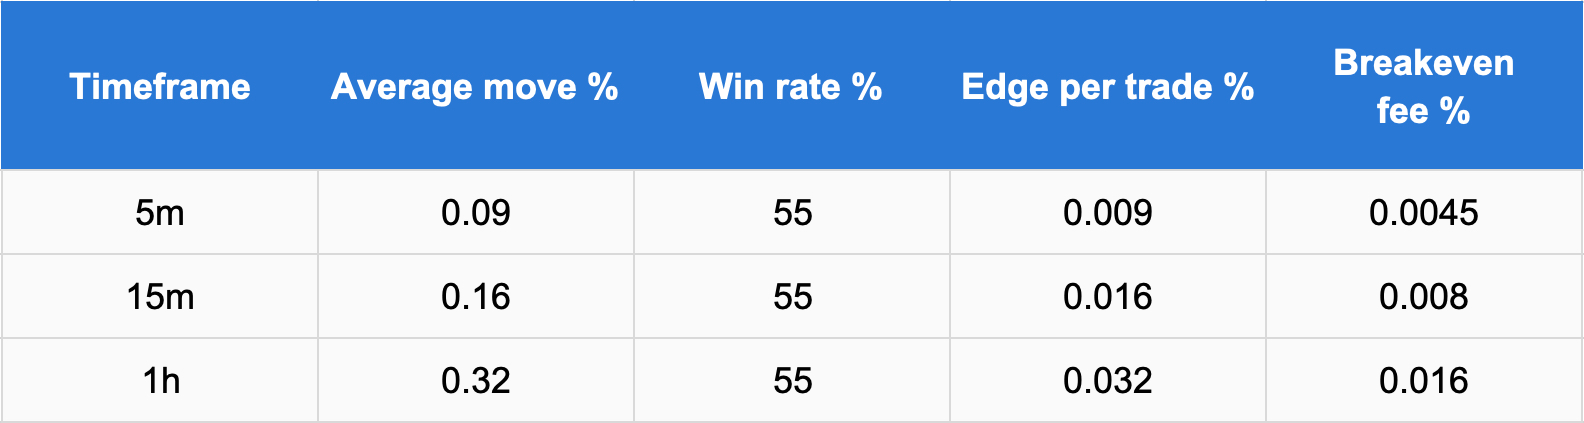
Now compare those breakeven numbers to what exchanges offers. On perpetuals, Binance is 0.02% maker and 0.05% taker; Hyperliquid is 0.015% maker and 0.045% taker. Only the 1h timeframe with the largest candle size is right at the edge of the breakeven fee. So the preliminary verdict is that the strategy isn’t viable under the assumption of a symmetrical win loss ratio. But let’s go further and see whether this assumption ever holds.
Are wins and losses symmetrical?
Signal. For 5m and 15m markets I use the last Polymarket trade before the candle open, so to get the signal as close to open as possible (median age: 1s and 2s). For 1h markets, last minute trades are less frequent, so I use the mid price from one-minute orderbook snapshots instead (bid/ask average). A trade is taken only when the signal skew exceeds a threshold away from 50/50: long if the Up price is higher, short if Down is. Entry is the open of the candle’s first minute and exit is the Close of its last, using Binance historical 1min klines.
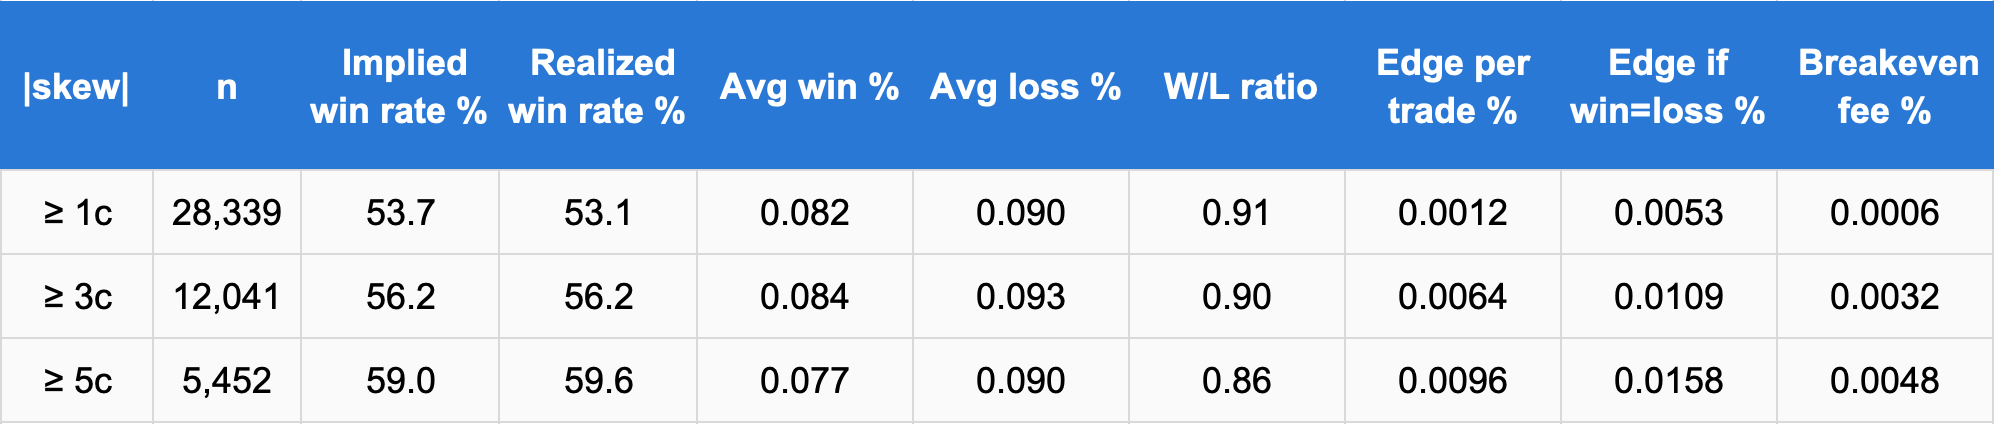
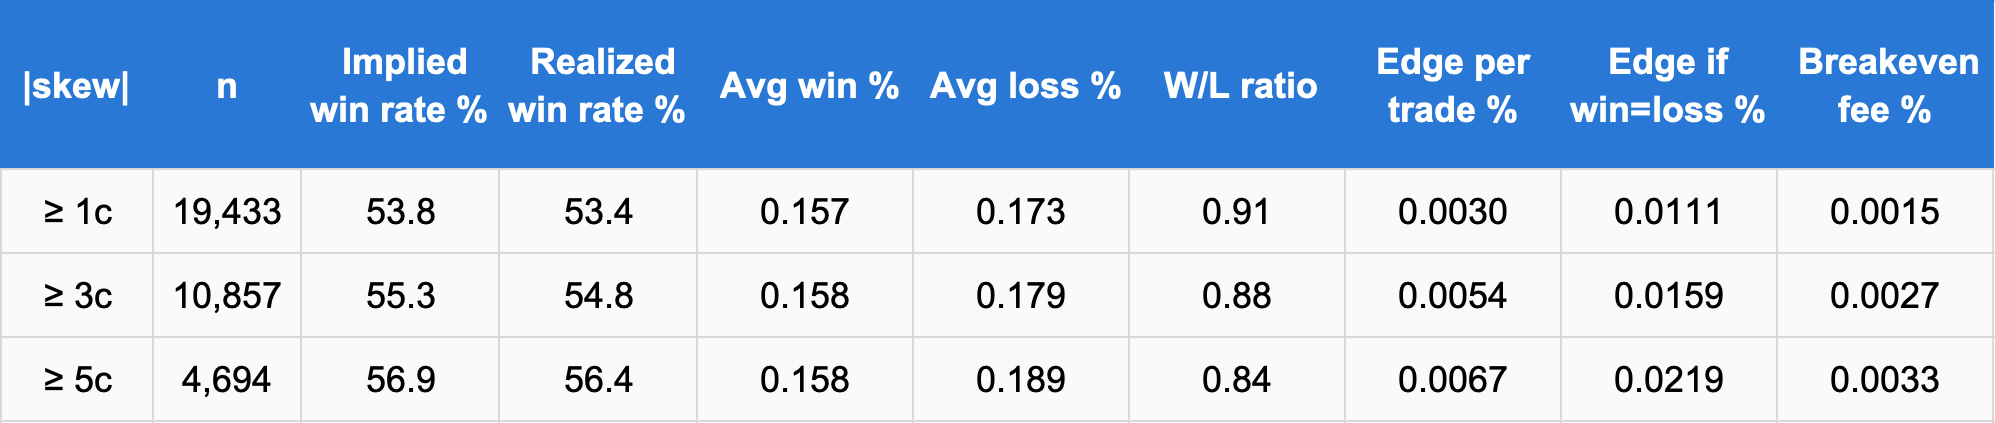
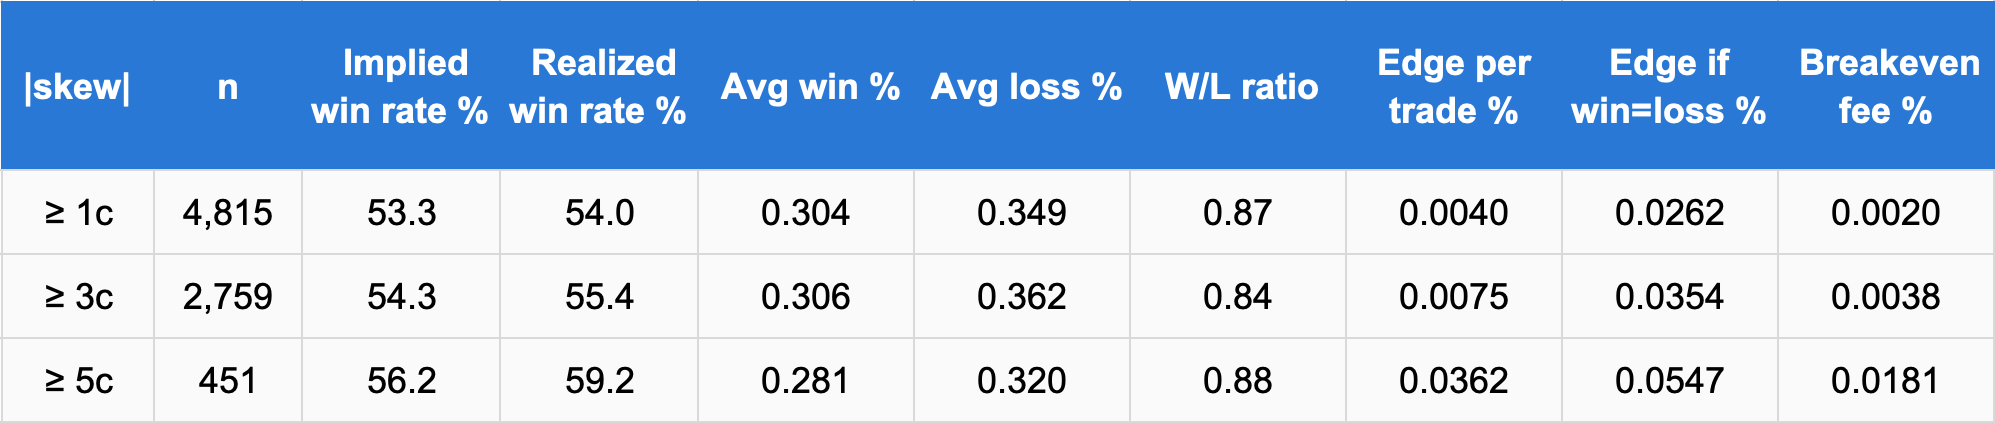
How to read the tables. Each row is cumulative and is a trading rule. ≥ 3¢ means: trade only when the market is at least 3 cents off 50/50 in either direction (for example 0.53/0.47 take a trade, 0.51/0.49 don’t). So the ≥ 1¢ row includes everything in ≥ 3¢ and ≥ 5¢, plus weaker markets. Edge is the average gross return per trade, before fees. Breakeven fee is that edge divided by two.
5m
Signal: last trade before open, median 1 sec | Mar 2026 - July 2026 | 43,864 markets
15m
Signal: last trade before open, median 2 sec | Nov 2025 - July 2026 | 25,907 markets
1h
Signal: order-book mid, median 54 sec before open | Nov 2025 - July 2026 | 6,252 markets
The results show something interesting.
The direction is right. The same finding as in the previous research. The realized win rate is very close to the prediction on all timeframes. And it rises as the skew grows.
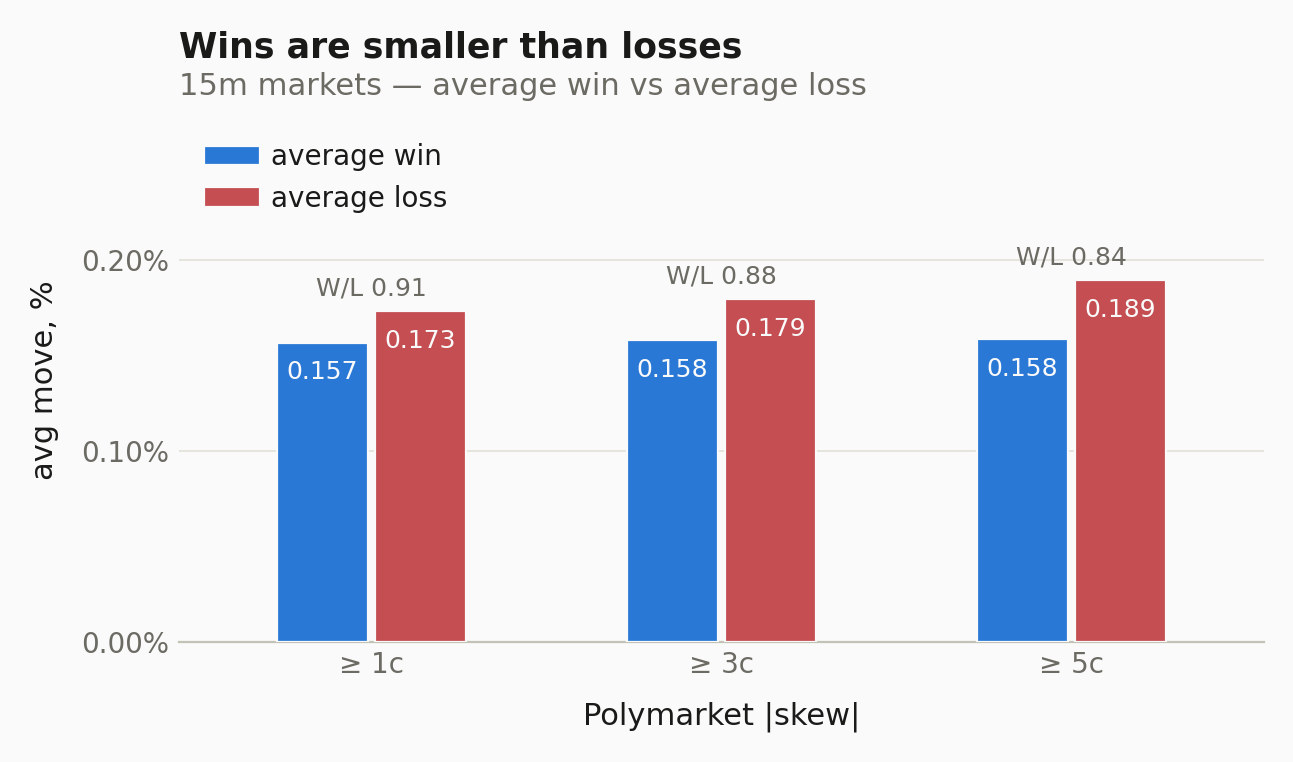
But wins are 10-15% smaller than losses. When the prediction is right, it yields less return than when it is wrong across all timeframes and at every threshold. The charts below use 15m as the example, but 5m and 1h look similar.
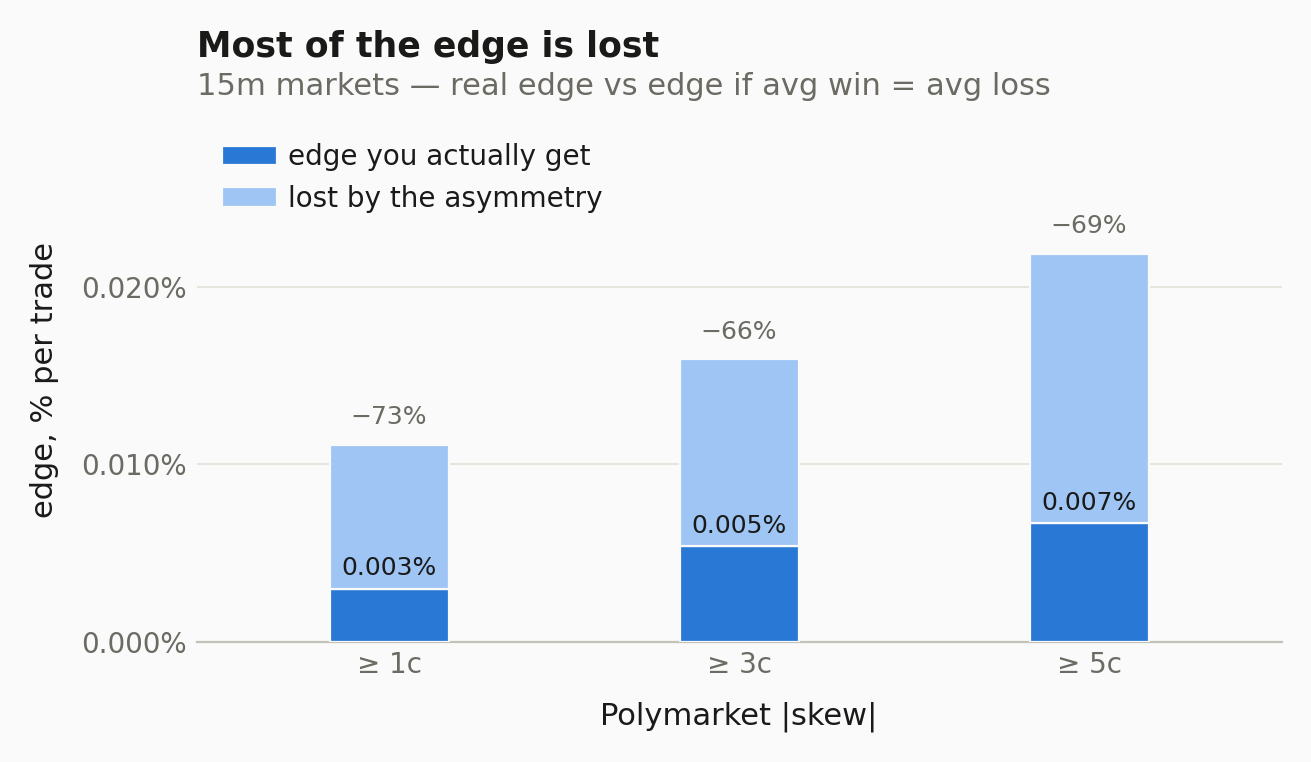
That makes the edge much worse than in the symmetric case. Compare the actual edge per trade with what it would have been under the symmetric assumption from the previous section. For example, at 15m ≥3¢ the symmetric edge would be 0.0159%, while the real one is just 0.0054% — 66% less.
Another finding is that on higher timeframes the potential edge doesn’t increase much. On 1h it greatly improves at ≥5¢ threshold but there are just 451 markets, so it shouldn’t be taken as a great finding.
Does it survive fees?
We’ve almost answered that question above. The strategy can only survive with near-zero costs. That could be realistic with higher VIP tiers or zero-fee promotions. But, keep in mind that orders can still suffer from slippage and spread, that will reduce even tiny edge more.
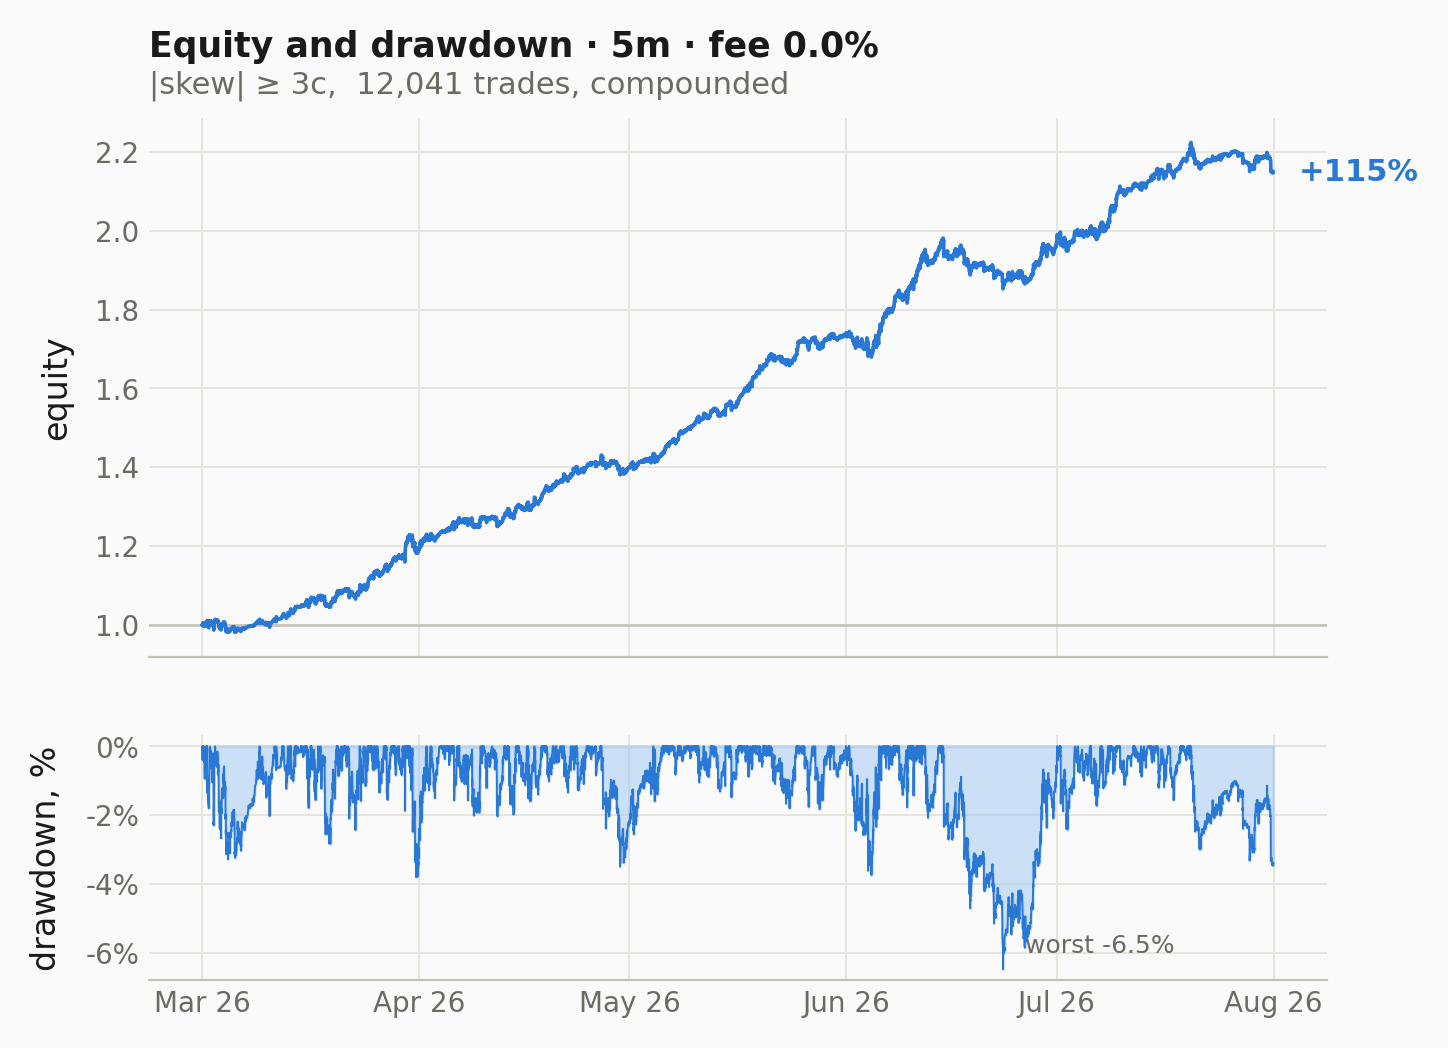
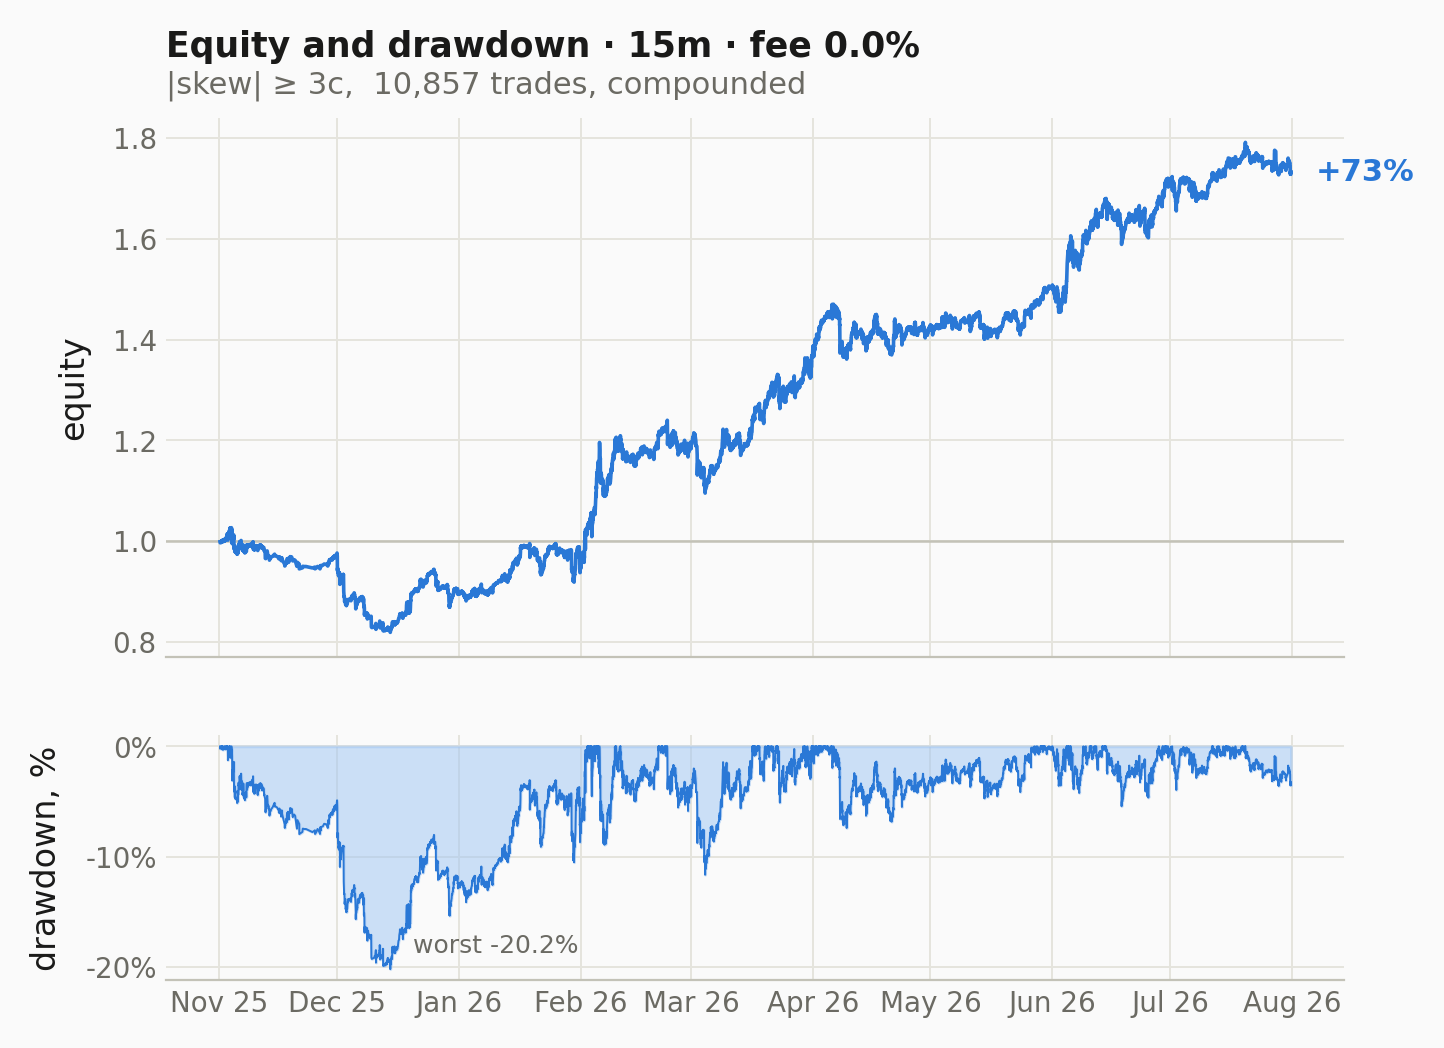
Still, let’s look at the performance under hypothetical zero fees. Below are the equity curves for 5m and 15m with a skew threshold ≥3¢.
5m, zero-fee
15m, zero-fee
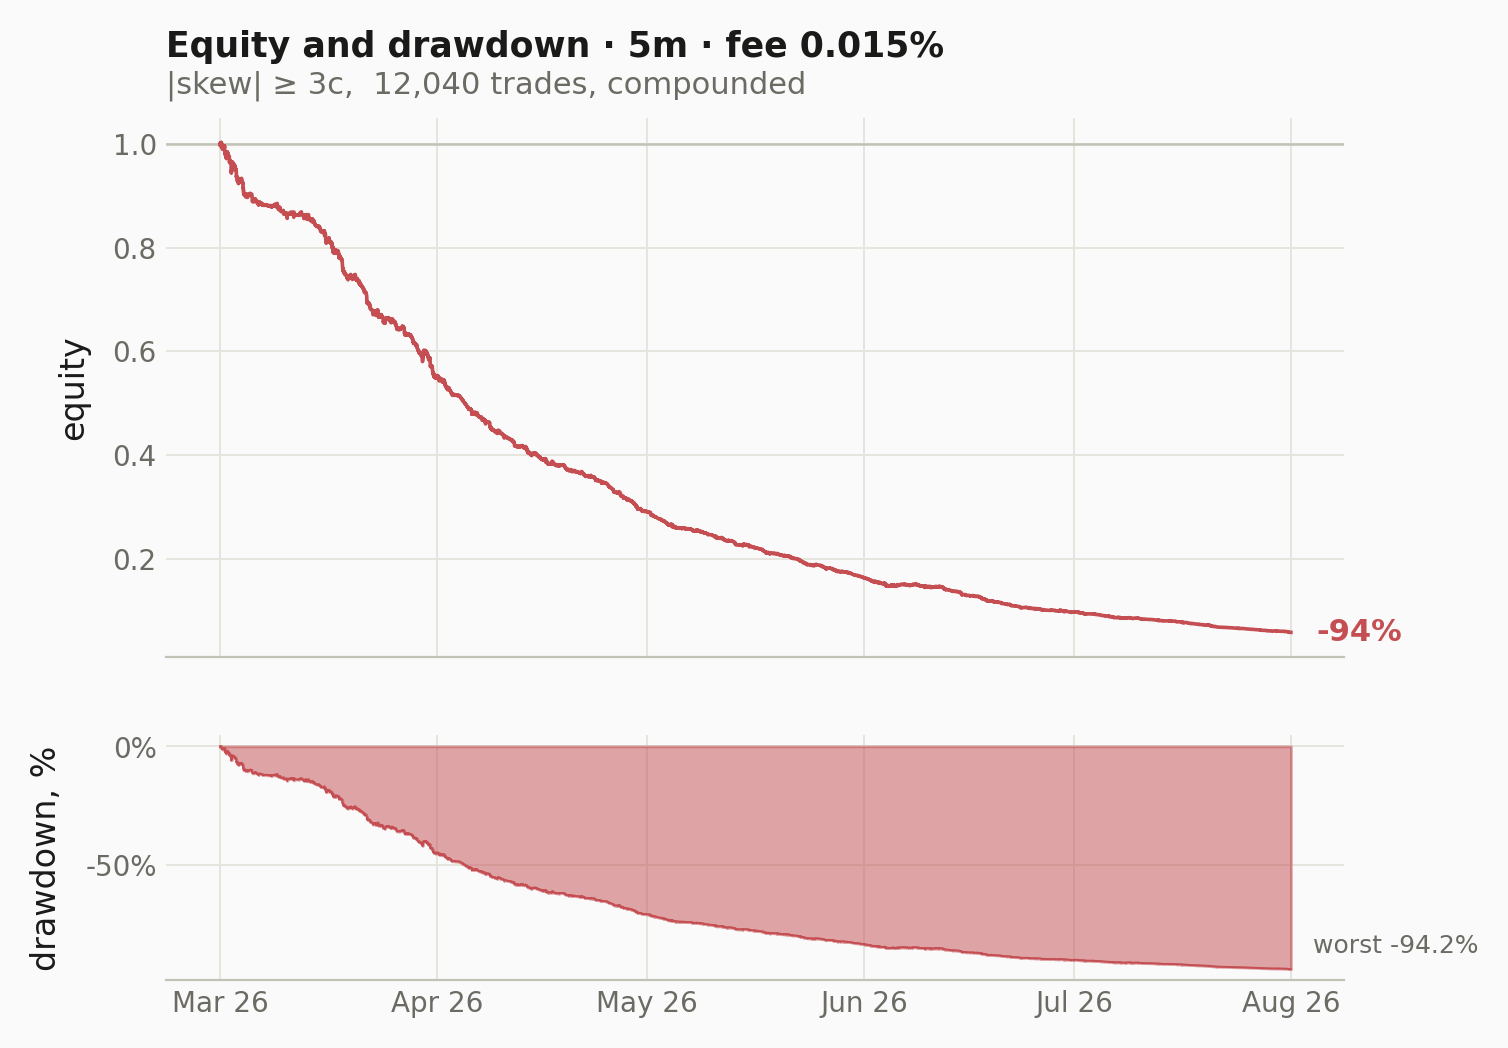
Introducing any fee makes even the best performance look untradable. With maker fee of 0.015% per side on 5m timeframe with ≥3¢ skew, turns +115% into −94%.
5m, 0.015% fee
Summary
Polymarket predicts the direction correctly, and the win rate is close to the predicted one. But the strategy is hard to trade. First, candle returns are quite small relative to fees. Second, when we’re right we make less than we lose when we’re wrong. Sign is not magnitude. The edge per trade is tradable only at zero cost.
Run it yourself
No need to install anything. Just run it on the Google Colab. The full per market dataset is published as a CSV file, every Polymarket signal with the matching Binance entry and exit, all three timeframes. Just change three numbers, re-run and get your own equity curve and drawdown:
TF        = '15m'   # '5m' | '15m' | '1h'
THRESHOLD = 0.03    # min skew to take a trade |price_up − 0.50|
FEE_PCT   = 0.00    # fee per side
Method notes
Signals come from Polymarket's free public APIs: Gamma for market metadata, the Data API trade feed, and CLOB one-minute price history); entry and exit prices are Binance spot BTC/USDT 1-minute klines: 43,864 markets at 5m (Mar 1 – Jul 31 2026), 25,907 at 15m and 6,252 at 1h (both Nov 1 2025 – Jul 31 2026). For 5m and 15m the signal is the last trade before the open, at most 30 seconds stale and half-spread corrected to approximate the mid between bid and ask; for 1h it is the order-book mid at T−1m, at most 120 seconds stale, because slow markets often have no last-minute trade, even if the book is quoted. Entry is the open of the candle’s first minute and exit is the close of its last minute. All returns are gross of funding and slippage, and assume fills at the exact open and close.
Nothing here is trading advice.
Resources
GitHub Repo — dataset, notebooks
Run the notebook in Colab — one click, no setup
Polymarket — prediction market platform discussed (referral link)
Polymarket API docs — the free public APIs this data comes from